Saki's From Zero to Hero Romhacking Guide Part 2: Debugging & Reversing

Whether it's the emulator/software you use which includes debugging features by default, or a third-party software that takes care of it, debuggers work in a pretty similar fashion: you run a program, either instruction by instruction, or "normally"/in real time, and you will be able to see how said program's memory, registers, and PC evolve. It's referred to as debugging since being able to step through a program one step at a time, and to notice how its' memory and registers change, to catch the eventual exceptions and when/where/why/how they happen, is how bugs are usually found and fixed by developers.
There are many debugging tools out there, but here is a small breakdown of the ones I use, and what for:
The GNU Debugger (GDB) is the caveman's option I resort to when working in a minimal C development environment, mostly on freshly installed Linux distros as it'd usually be bundled with GCC and your plethora of GNU tools. It's a CLI software, which should tell enough on its' own.
Cheat Engine is a better known, beginner-friendly, but unfortunately limited to Windows program (though you can run it with Proton/WINE). It emphasizes on memory inspection, very useful if you happen to work with an emulator whose native debugging features aren't very readable (looking at you, PPSSPP).
x64dbg is a debugger which targets x32 and x64 programs. Its' UI is quite intimidating at first, but very useful to track a program's branching paths with its' drawn arrows for each jump instruction.
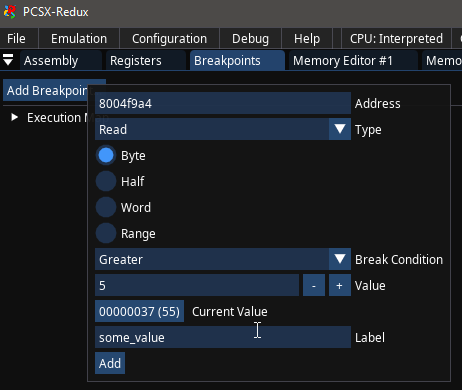
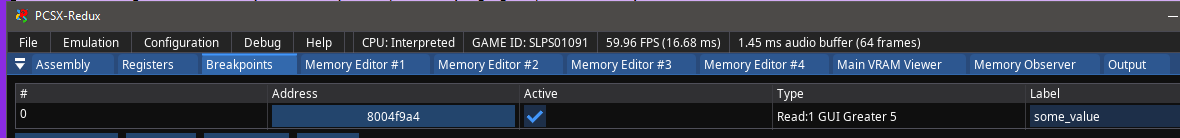
PCSX-Redux's debugger is one of the best I've ever had to use, very heavy recommend if you want to debug PS1 games.
Ymir is seemingly just as good and intuitive for Sega Saturn titles.
All of those tools share common concepts and terms, which I will introduce below. Note: this terminology assumes you either read the previous blogpost or know how a program is organized and what an instruction is.
When debugging a software, you will do so from one particular instruction. Usually, it'd be the entry point of your program, so your main function. In contrary of your normal program execution, the debugger would not automatically execute all of the instructions in the main function one after another. Instead, you'd do so manually by stepping from the current instruction into the next. The program's current registers and memory would be updated (and usually highlighted) between every state.
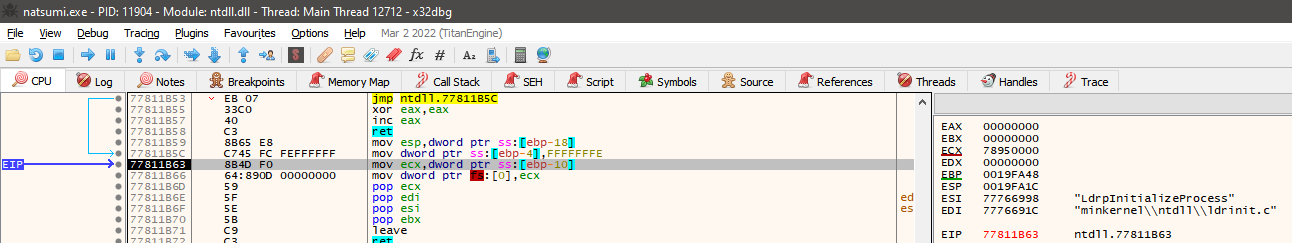
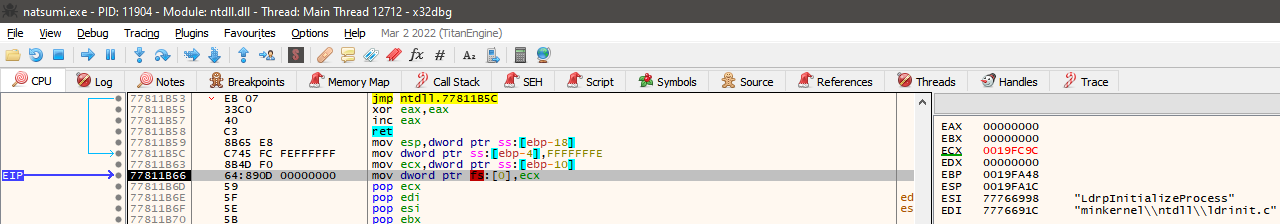
There are three types of steps. When you Step Into an instruction, you step from the current instruction to the next one as the program normally would. If the next instruction is a jump instruction, the jump would be made. When you Step Over an instruction, you ignore said jump. When you Step Out of a function, you skip all of the instructions of the function you're in until you leave it (mainly useful when we're inside of a sub-function and want to return to the main one).
Another useful command to go through a program's instructions is the Run command. This command will execute all of the instructions we'll encounter, until the program ends... Or until we reach a breakpoint. But what is a breakpoint ?
A breakpoint is a flag set on a specific instruction which tells the debugger "you will stop running if you reach this instruction", it's useful when we want to inspect the way the program behaves when reaching a specific point in the code, or when there was a crash and we want to understand where and how it happened.
There are three types of breakpoints. The Execution Breakpoint will stop the debugger once the Program Counter is equal to a specific address. The Write Breakpoint will do so if a certain address is written to by the program, and the Read Breakpoint will do it if an address is read from by the program. Some debuggers allow to add other conditions on top of the initial read/write, such as "on change" or "if greater than". For example, if you're working on a PS1 game and you know that the game stores its' lives at address 0x8010345A, you can set a write breakpoint there and find out which exact function(s) update the value.
Believe it or not, but with this little knowledge you've already seen all that should be known about debuggers. How useful they will be to you would depend on the way you use them.
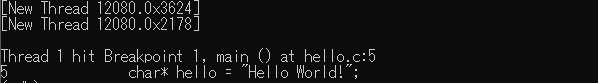
Note: in very rare cases, or when you're the one doing the compilation, a program can embed Debug Symbols in its' binary data.
This way, whenever a debugger or a disassembler would be ran, we would be able to see the name of the functions and variables used as they were in the original source code, rather than generic names.
With GCC for example, you can add the -g flag when compiling a project so the debug symbols would be embedded into an executable.

If you don't know what a disassembler is, I highly recommend you read my previous post's introduction, but basically it's a program that will try to reconstitute a binary executable's assembly, and it often goes a step beyond in the process, also attempting to decompile it (reconstructing some human-readable code in a target language). Unlike debuggers, disassemblers don't run the executable but analyse it statically instead, following the flow of assembly instructions to guess where functions and variables are located. A well-known example is objdump on Linux system.

As it turns out, there aren't many tools which offer disassembly/decompilation features without also allowing the user to debug the binary they'd analyze. When you reverse engineer a program, i.e when you want to understand how it works without having the actual source code, you don't really want to have to choose between statically analyzing disassembled code or hammering your way through with a debugger, both are valid ways of deobfuscating an executable's behaviour so why hold yourself back? As such, whether you'd use Ghidra, IDA Pro, Binary Ninja, or more language-specific tools like dnSpy, they'd all offer debugging and disassembly/decompilation as features at the same time.
Here is what I generally do when I try to understand a program's logic with the tools I'm given:
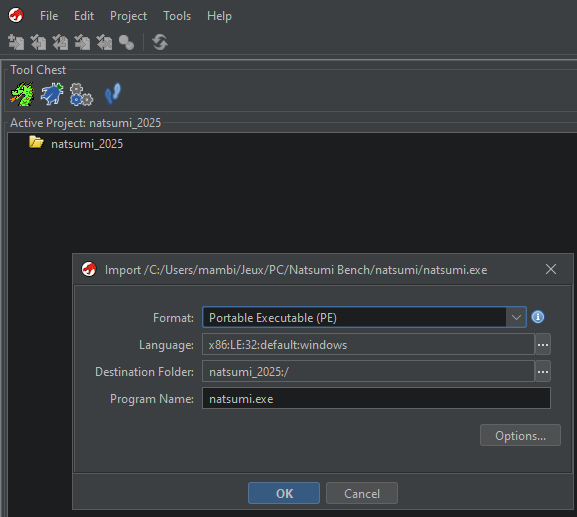
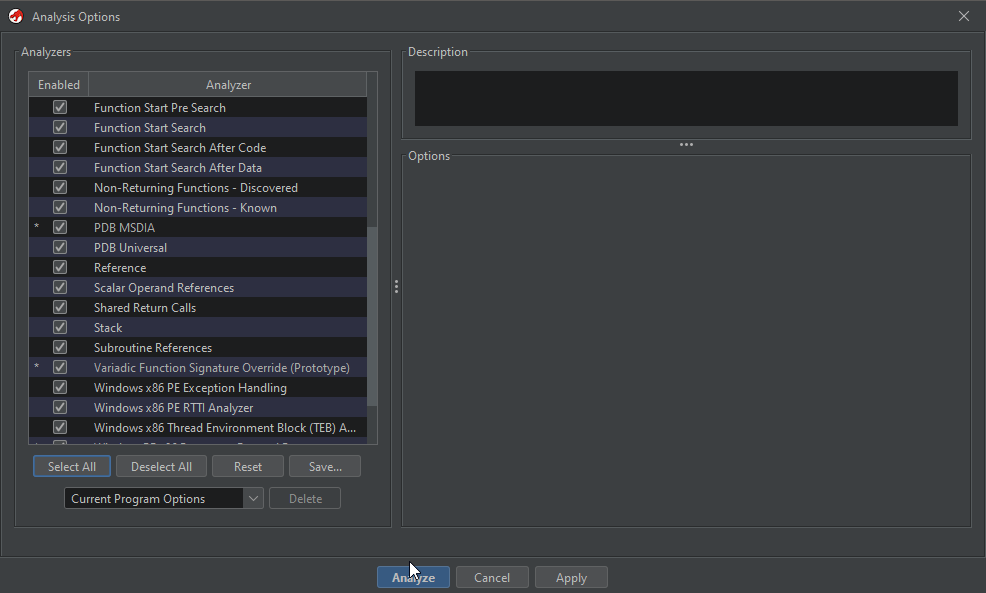
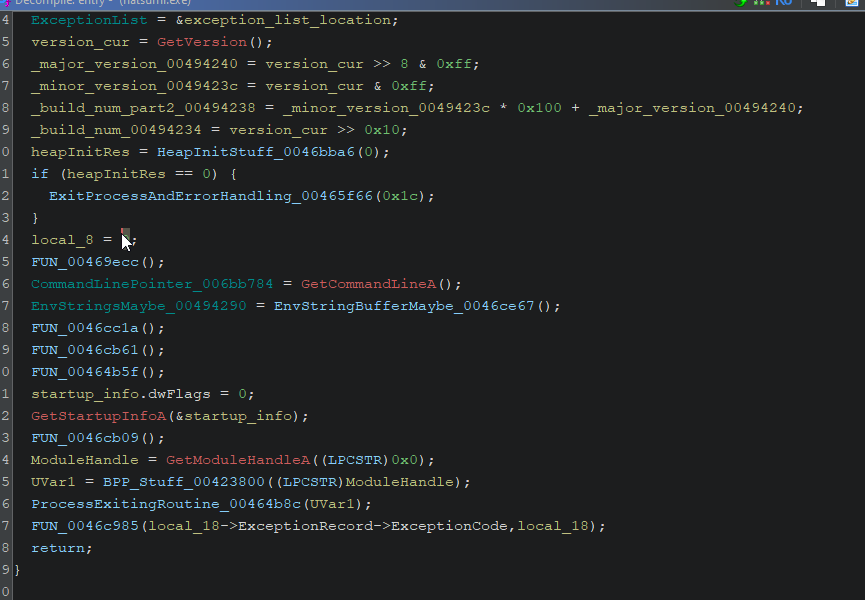
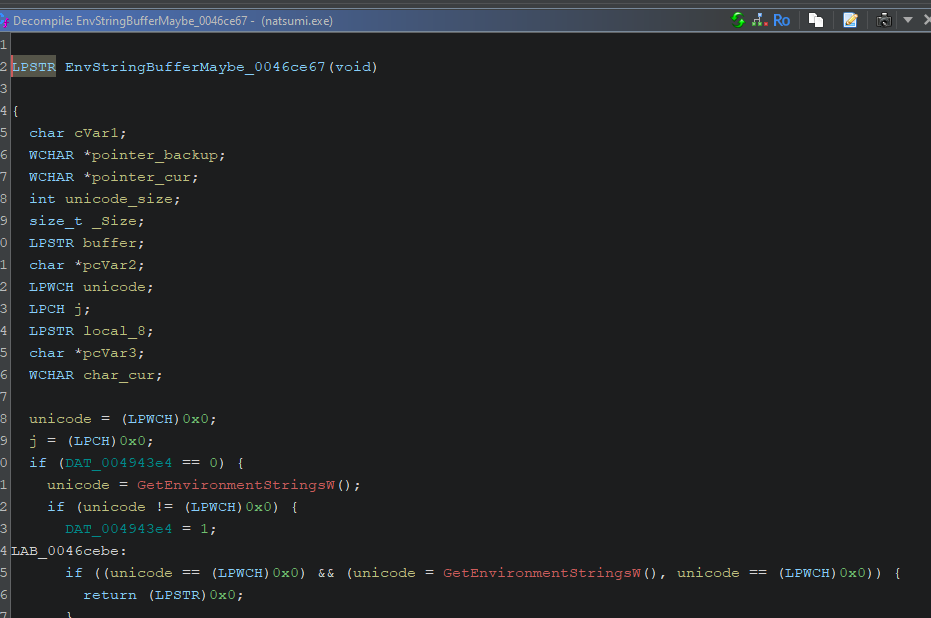
First, I throw the binary file to a general-purpose reverse engineering tool, usually it will be Ghidra since the NSA's ultimate swiss knife happens to be free, actively maintained, and offers many community-made plugins for specific architectures and executables such as the PS1's MIPS R3000 binaries, or the Xbox 360's PowerPC .xex files. Once the executable is imported, you'd usually be given analysis options, I tick everything and let the magic work itself.
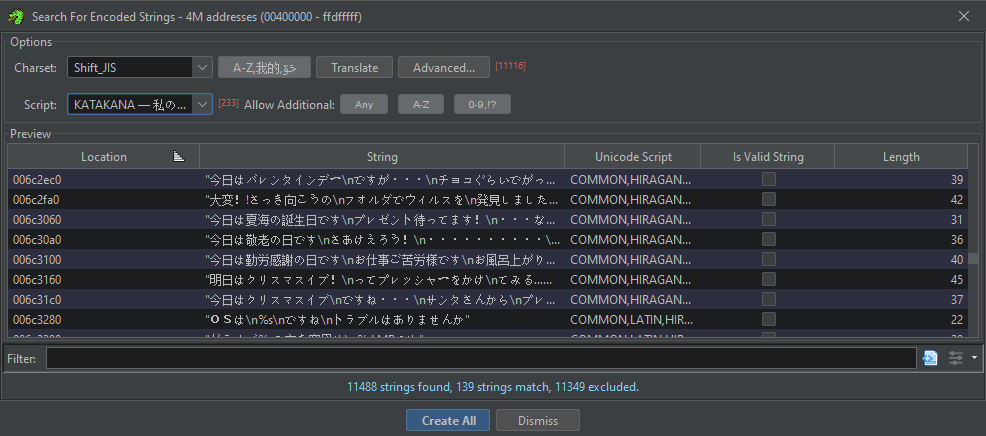
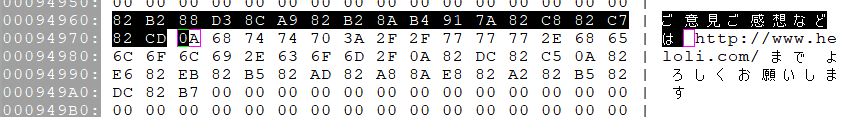
Then, I let the program find all the functions it could, and I'll usually run a specific scan for strings, since Ghidra also supports non-ASCII/UTF encodings nowadays.

From that point, it's time to get funky: programs that have reverse engineering in mind will usually allow you to rename any variable and function you encounter to make the code more readable, and provide you with a documentation for any known/standard function it encounters. Often enough, guesswork can lead you pretty far, the main goal of the game is now to rename/retype as many variables as possible until things start making sense. If something doesn't click together, you'll still be able to experiment until it does.
Sometimes we will stumble upon a collection of pointers, or perhaps an array, of which we can make sense and turn into a structure: Ghidra allows us to define our own types and structures, so it is recommended to take advantage of the feature.
Whether you're confident about your guesses or not, the next step would be to edit the binary to confirm your theories: you can use the information about a variable/instruction's location in memory in order to open the binary file at the same position in your Hex Editor. Then, the job would be as easy as changing the data to what you need it to be, and see if the program ends up behaving the way you intended it to. If it does, good job, you cracked the code and can move on with modifying the program further. If it doesn't, you will need to review your changes and make sense out of what broke the executable. You can also launch the program with a debugger to have a precise trace of what went wrong.


Keep up at it long enough, and you should be able to make all of the modifications, and understand all the parts of a program that you would consider relevant.
There isn't much to say about the general use of debuggers and disassemblers, it's honestly a knowledge that mainly comes with practice. Do not be afraid of opening up one of your favorite (or not) pieces of software in a debugger and watch step by step what exactly goes under the hood. Be even less afraid to decompile an executable with Ghidra, and lose yourself into a senseless flow of functions and branches. Break stuff, fix stuff, patch stuff, and you will get somewhere eventually. My next blog post will be a demonstration of the process through the making of Magical Date: Doki Doki Kokuhaku Daisakusen's English Patch. Thank you for reading and until next time.
Previous Page